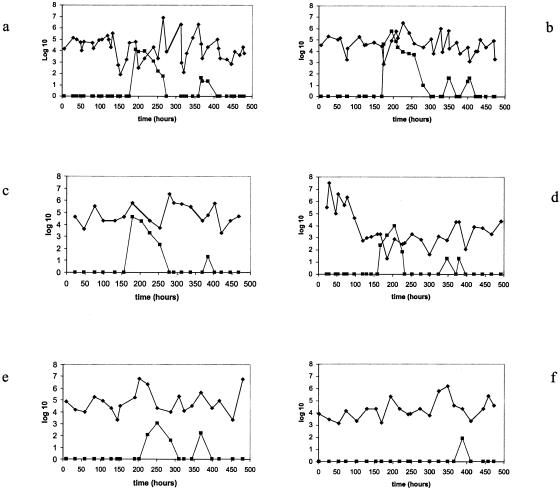
FIG. 1.
Fecal phage and E. coli counts in the five individual volunteers receiving the products in the sequence placebo-higher phage dose-lower phage dose during the study period (time in hours after start of treatment) (panels a to e). (f) Excretion pattern of a possible “low phage responder” receiving the sequence lower phage dose-placebo-higher phage dose. The fecal phage titers (expressed as log10 PFU/g stool) are represented by squares, whereas the fecal E. coli counts (expressed as log10 CFU/g stool) are depicted with diamonds.

