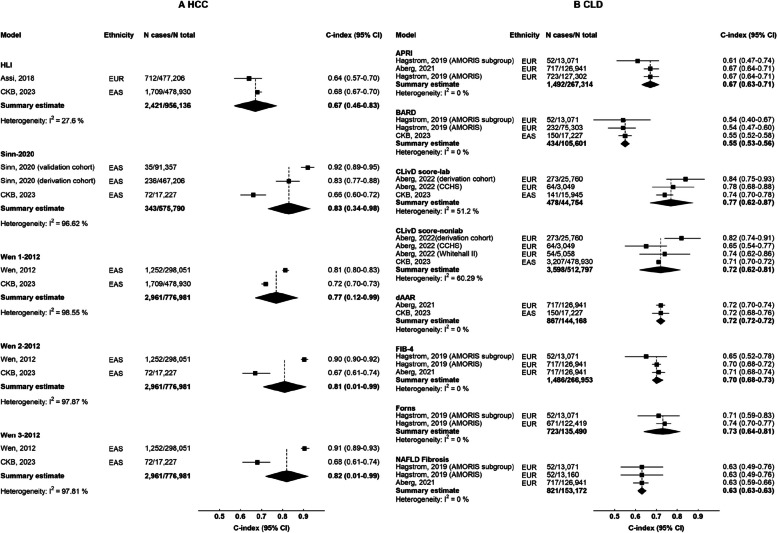
Fig. 4.
C-index of risk prediction models for HCC and CLD in meta-analysis of CKB and published studies. Boxes represent the C-index for predicting 10-year A HCC or B CLD in the general population. Diamonds represent summary C-index for each model, with the size of the diamond showing 95% confidence interval. For each model, published studies are sorted according to number of participants. Estimates and 95% CI of the summary C-index are shown in bold. The CIs of the summary estimates for HCC models were truncated because of the relatively low SE calculated using the “metamisc” package

