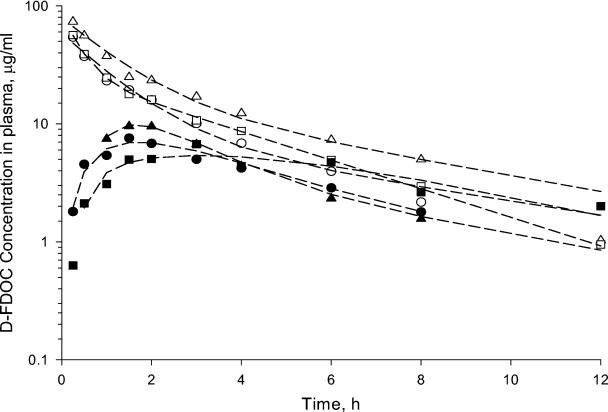
FIG. 3.
Observed (symbols) and model-predicted (lines) plasma concentrations of d-FDOC versus time profiles in rhesus monkeys after the administration of 33.3 mg of compound/kg by the i.v. (open symbols) and oral (solid symbols) routes. (Please refer to the text.) To convert micrograms/milliliter concentrations to molar concentrations, values were multiplied by 4.3.

