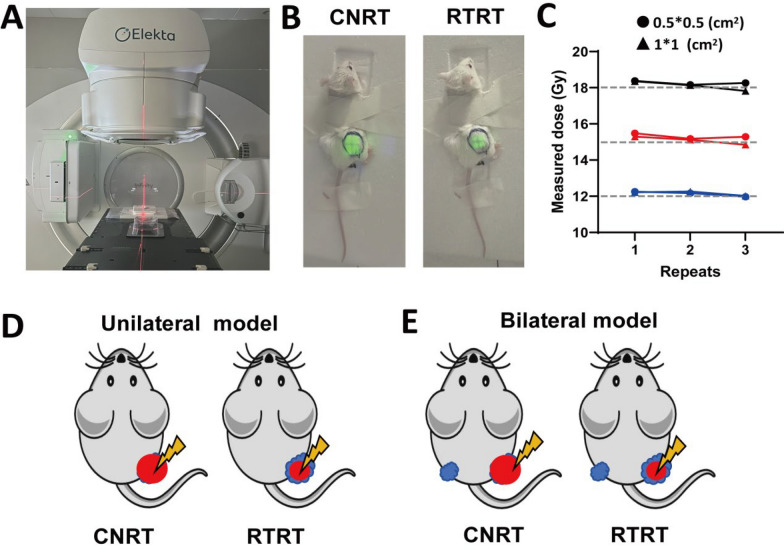
Fig. 1.
The irradiation device and the target areas for tumor irradiation. A Laser location (Red) during irradiation. B Simulated photographs of conventional radiotherapy (CNRT) and reduced tumor area radiotherapy (RTRT) of mouse tumors (Green). C Stability of irradiation dose for small area irradiation. The gray line represents the theoretical value of irradiation. D Schematic of mouse tumor irradiation in a unilateral model. Blue: tumor. Red: irradiated target areas. E Schematic of mouse tumor irradiation in a bilateral model. Blue: tumor. Red: irradiated target areas

