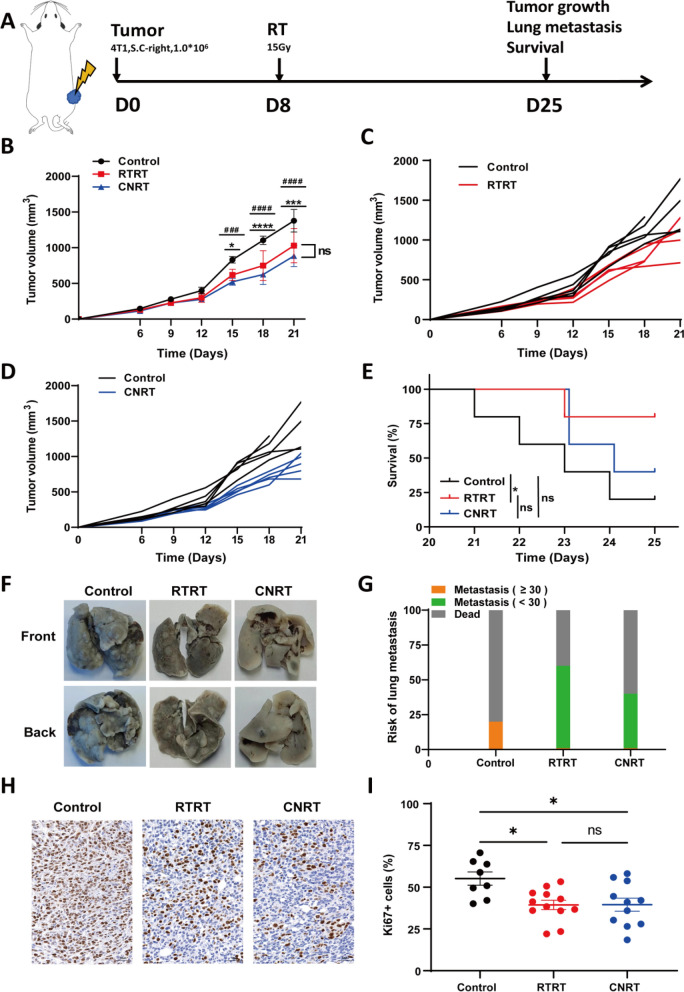
Fig. 2.
RTRT is comparable to CNRT in tumor control. A Schematic diagram of tumor model construction and irradiation in a mouse tumor model. B Tumor growth curves of unirradiated (Control), RTRT, and CNRT in a mouse tumor model (n = 5). #, Control vs CNRT. *, Control vs RTRT. #/*, P < 0.05. ###/***, P < 0.001. ####/****, P < 0.0001. The statistical test was performed using One-way ANOVA, followed by Tukey’s multiple comparisons test. C Tumor growth curves for each mouse in control and RTRT groups. D Tumor growth curves for each mouse in control and CNRT groups. E Kaplan–Meier survival curves were generated to compare mortality between groups, and significance was determined by log-rank (Mantel-Cox) test. *, P < 0.05. F, G Physical map of lung tissue and quantification of lung metastasis of tumors after control, RTRT, and CNRT in a mouse tumor model. H, I Immunohistochemical images and quantification of Ki67+ cells in each group. *, P < 0.05. ns indicates no statistical difference. The statistical test was performed using One-way ANOVA, followed by Tukey’s multiple comparisons test

