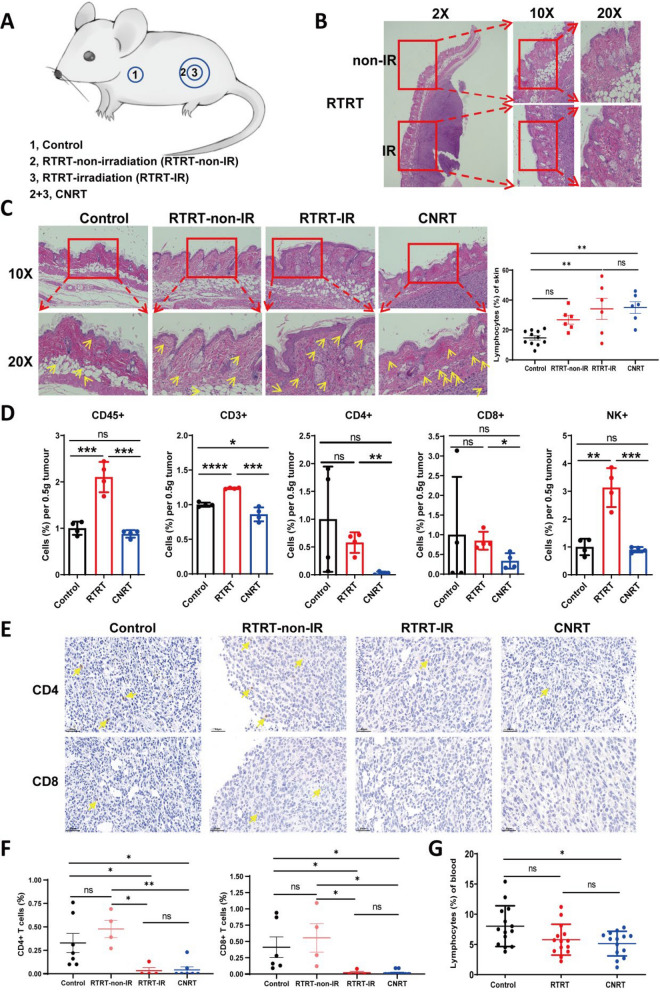
Fig. 3.
RTRT protects skin and lymphocytes. A Schematic representation of different treatments of mouse skin tissues. B Representative picture of HE staining of skin lesions on the surface of tumors treated with RTRT. C HE staining images of skin tissue and skin infiltrating lymphocytes of mice in control, RTRT and CNRT group (Left). Quantification of skin infiltrating lymphocytes in each group (Right). Yellow arrows indicate lymphocytes infiltration. D Analysis of immune cell subsets in tumor tissues of each group by Flow cytometric analysis. n = 4. E Immunohistochemical images of CD4+ and CD8+ T cells in tumor of control, RTRT and CNRT group. Yellow arrows indicate lymphocytes infiltration. F The quantification of CD4+ and CD8+ T cells in tumor of each group. G Percentages of lymphocytes in peripheral blood of mice irradiated with different methods. *, P < 0.05. **, P < 0.01. ***, P < 0.001. ns indicates no statistical difference. The statistical test was performed using One-way ANOVA for multiple groups, followed by Tukey’s multiple comparisons test. The statistical test was performed using Student’s t-test for two groups

