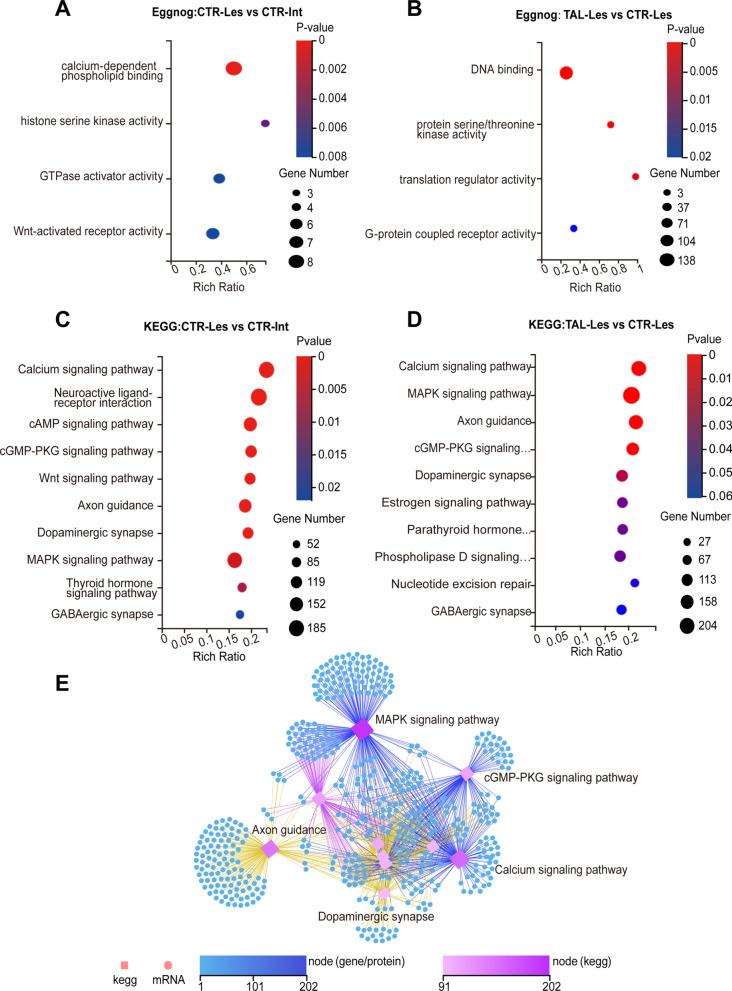
Fig. 2.
TAL modulates intracellular signaling pathways. A, B Functional annotation of the striatal transcriptome using Eggnog. C, D KEGG enrichment analysis of transcripts. DEGs are divided into 10 KEGG pathway terms along the y-axis. E Ranking of KEGG pathways based on the number of genes associated with selected genes. The top 10 pathways with the highest gene count are displayed. Squares represent KEGG pathways, circles represent mRNAs, and the color and size indicate the number of transcripts connected to each node

