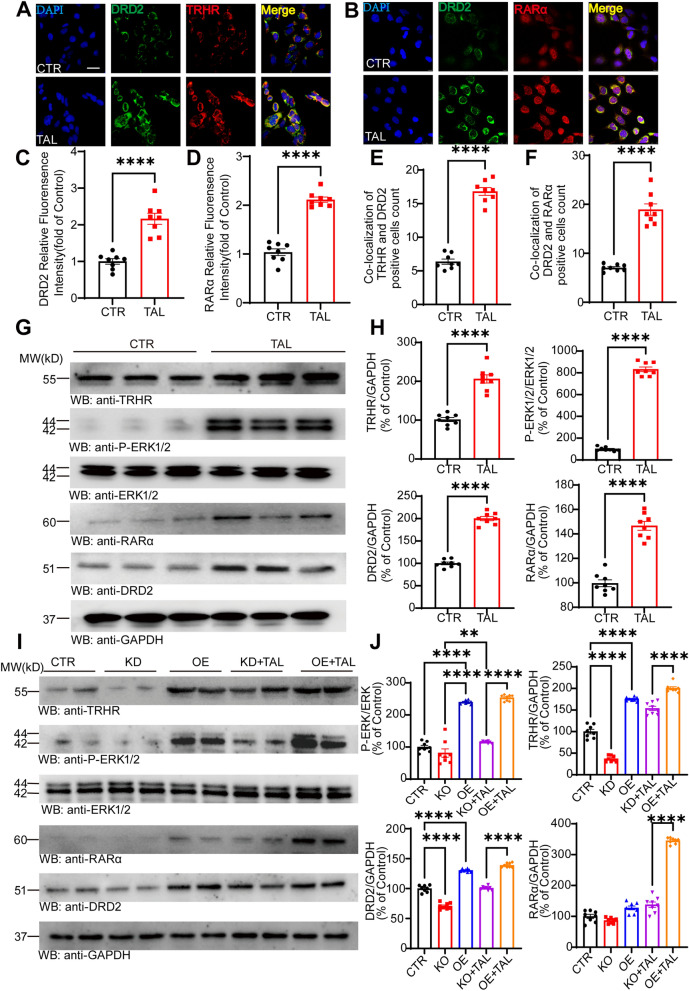
Fig. 7.
TAL enhances the expression of TRHR and DRD2 in SH-SY5Y cells. A, B Immunofluorescence colocalization of DRD2 with TRHR and RARα in SH-SHY5Y cells of the CTR and TAL groups. Scale bar: 25 μm. C, D Analysis of the relative fluorescence density of DRD2 and RARα in cells from the CTR and TAL groups (N = 8/group; error bars represent SEM). Statistical significance: ****P < 0.0001, Student’s t-test. E, F Analysis of the count of colocalized positive cells of DRD2 with TRHR and RARα in different groups of cells (N = 8/group; error bars represent SEM). Statistical significance: ****P < 0.0001, Student’s t-testt. G, H Western blotting analysis of TRHR, P-ERK1/2, ERK1/2, RARα, and DRD2 levels in the SH-SY5Y of CTR and TAL group (N = 8/group; error bars represent SEM). Statistical significance: ****P < 0.0001, Student’s t-test. I, J After knockdown and overexpression of TRHR, Western blotting analysis of TRHR, P-ERK1/2, ERK1/2, RARα, and DRD2 levels in each group of SH-SY5Y cells (N = 8/group; error bars represent SEM). Statistical significance: **P < 0.01, ****P < 0.0001, one-way ANOVA followed by Tukey's test

