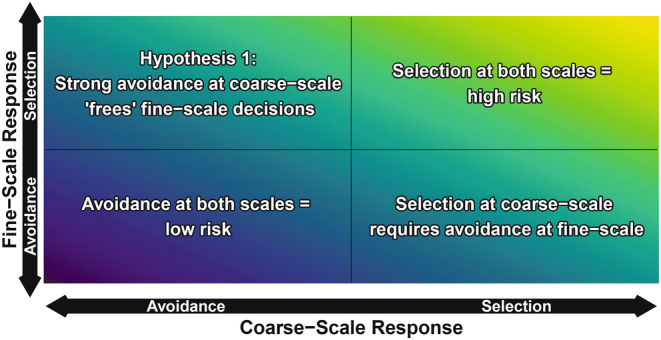
FIGURE 1.

A conceptual figure of the hypothesised relationship between coarse‐ and fine‐scale response to depredation mortality risk where the strength of selection or avoidance of risk at each scale influences the level of risk that an individual is exposed to (purple = low risk, yellow = high risk). Our first prediction is best reflected by the top left panel, where strong avoidance of depredation mortality risk at a coarse scale frees an individual to relax avoidance of risk when making fine‐scale selection decisions.
