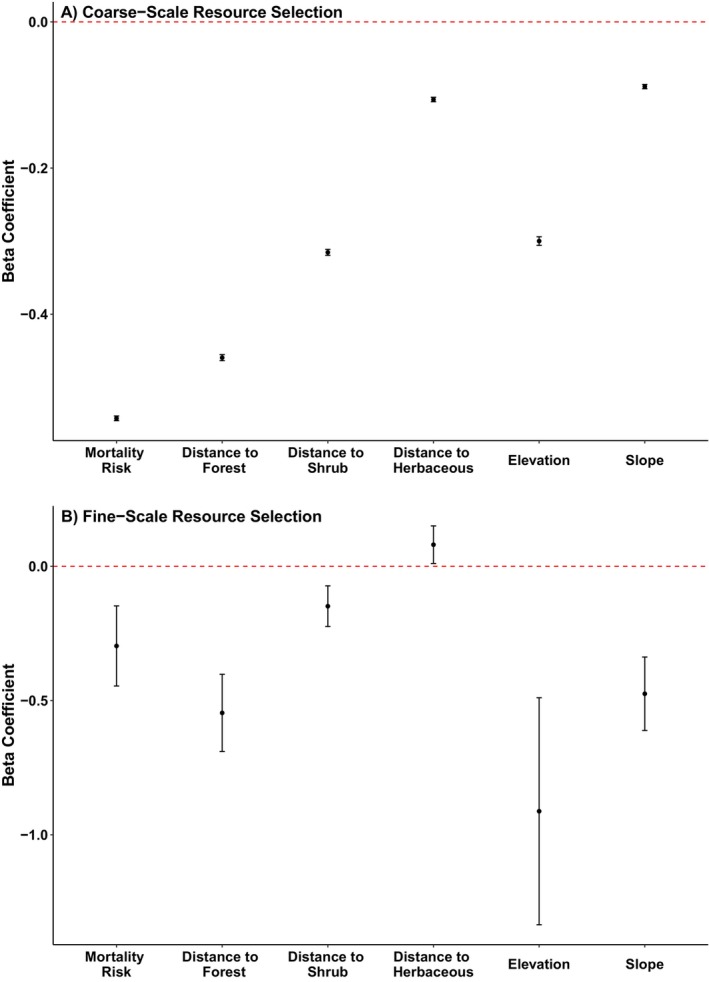
FIGURE 3.

(A) Coefficient plot from the second‐order resource selection function investigating California mountain lions' (n = 244) population‐level responses to landscape features when selecting home ranges from the larger landscape. (B) Coefficient plot from the 2‐h step‐selection function investigating California mountain lions' (n = 144) population‐level responses to landscape features when making selection decisions along movement paths. For classification‐based variables (depredation mortality risk, elevation, slope), values less than 0 indicate avoidance, whereas values greater than 0 indicate selection. For distance‐based variables, values less than 0 indicate selection, whereas values greater than 0 indicate avoidance.
