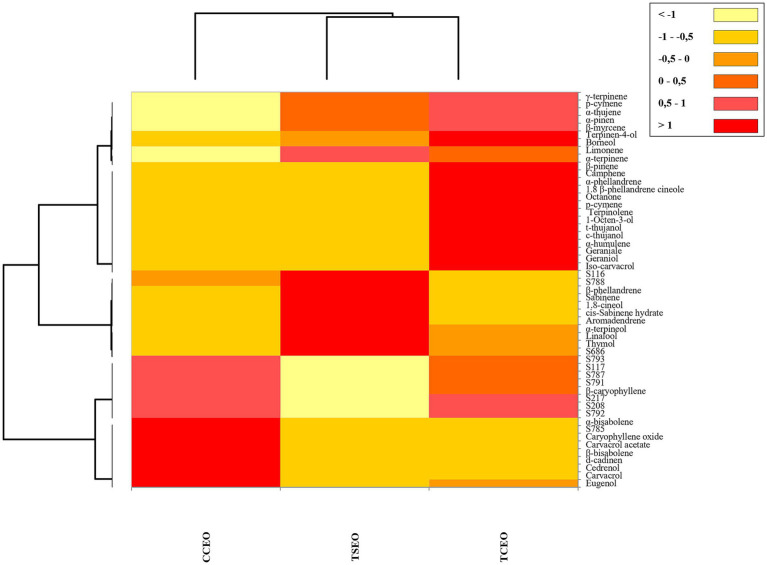
Figure 1.
Heatmap diagram based on the fractional volatile compounds amount and on the results of the antibacterial activity (MICs) of C. capitatus (CC), T. capitatus (TC), and T. serpyllum (TS) EOs in combination with tetracycline (Tc) compounds for 48 h at 37°C. Columns represent the three EOs and rows represent the different bioactive compounds and the response of the S. enterica strains (S) to treatments. The color intensity is proportional to the amount (μL/mL) of EOs volatile compounds and to the MICs values (μL/mL or μg/mL). The color discoloration starting from red (the highest value) to yellow (the lowest value).

