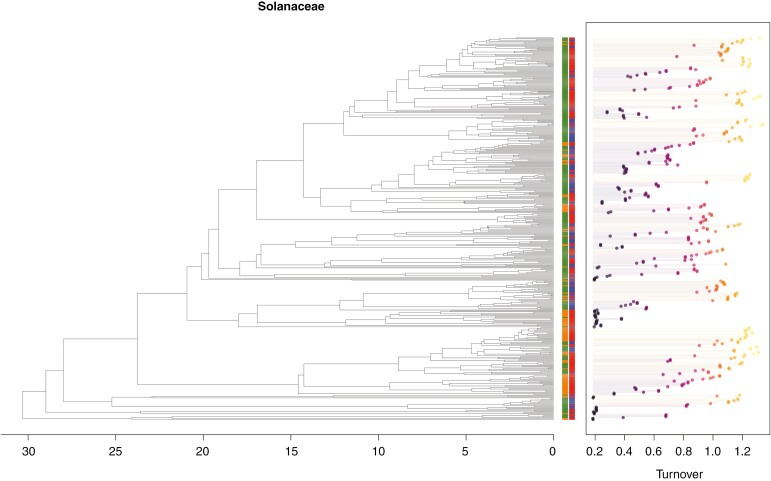
Fig. 2.
Solanaceae phylogeny with tip states and turnover tip rates. Tip states for ploidy are shown in green (diploids) and orange (polyploids). Tip states for breeding system are shown in blue (self-incompatible) and red (self-compatible). Turnover rates for each species are shown on the right, with colour varying from black to light yellow as rates increase.

