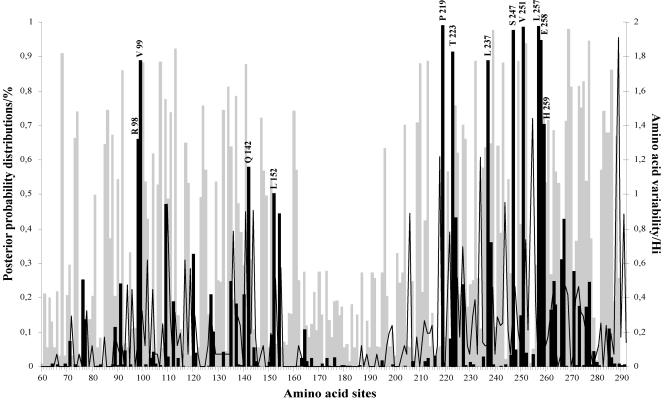
FIG. 5.
Posterior probabilities of sites for different classes along the G protein ectodomain region under the discrete model M3. This model assumes three classes of sites in the gene: positive sites (black bars), neutral sites (open graph), and negative sites (gray bars). Positively selected amino acid sites with posterior probabilities above 50% are indicated according to strain WV/B1/85. Amino acid variability, measured by entropy (Hi), is plotted to the second y axis.

