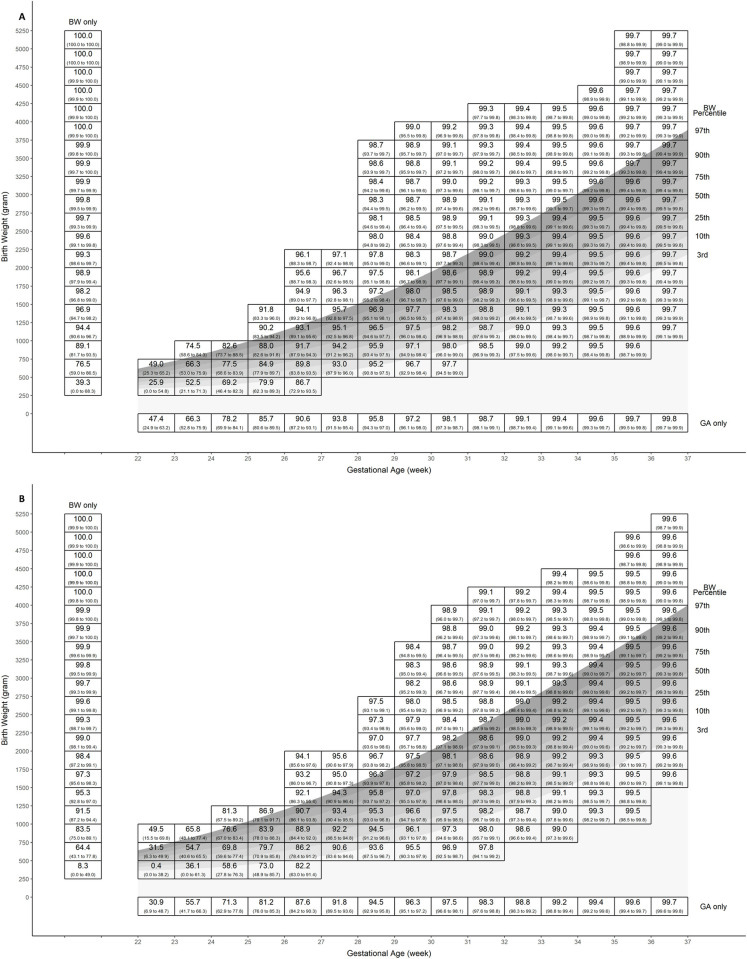
Fig 2. Grid of predicted neonatal survival rate according to sex, birth weight, and gestational age (BW-GA-based model).
The point estimate in each cell is the predicted survival rate at the midpoint of the cell. The numbers in parentheses are lower and upper limit of predicted survival rate within each cell. A, female plot. B, male plot. BW, birth weight; GA, gestational age.

