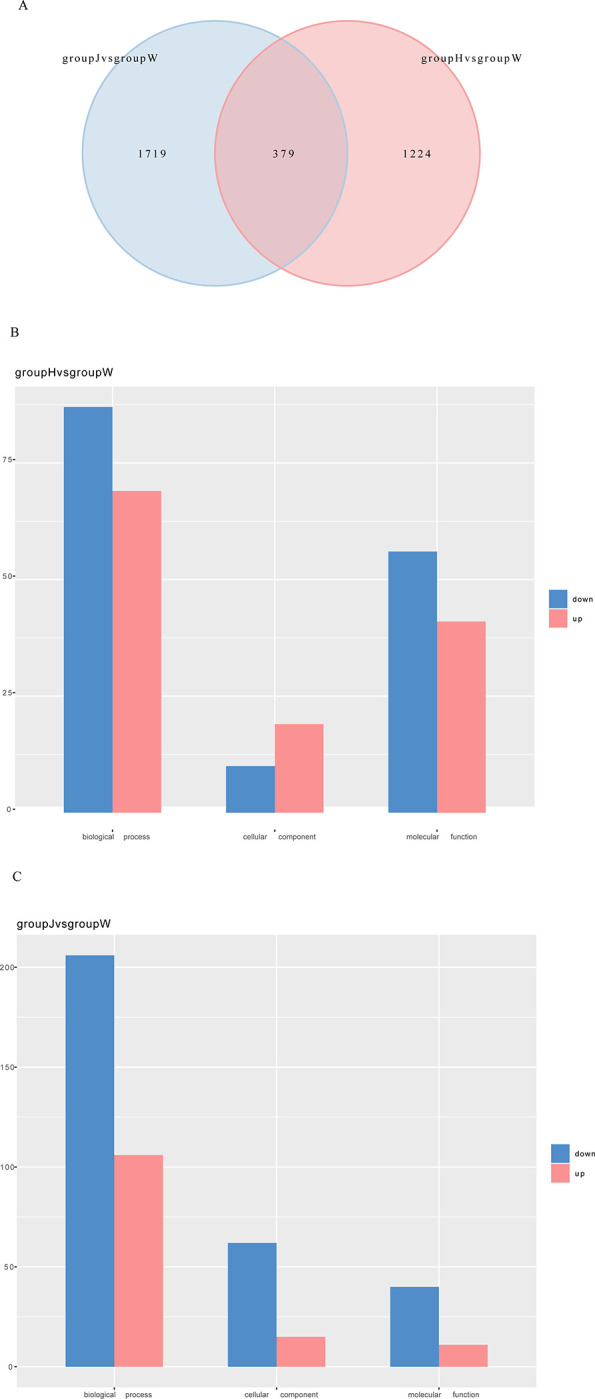
Fig 5. Differential genetic Venn diagram of groups J and H compared with group W and GO enrichment histogram of differentially expressed genes.

A. Venn diagram between group J vs. group W and group H vs. group W. The number of genes expressed uniquely within each group is shown and overlapping regions indicate the number of genes expressed in both groups. B. Comparison of GO enrichment analysis for up-and down-regulated genes between groups H and W. C. Comparison of GO enrichment analysis for up- and downregulated genes between groups J and W. X-axis: number of genes; Y-axis: GO categories.
