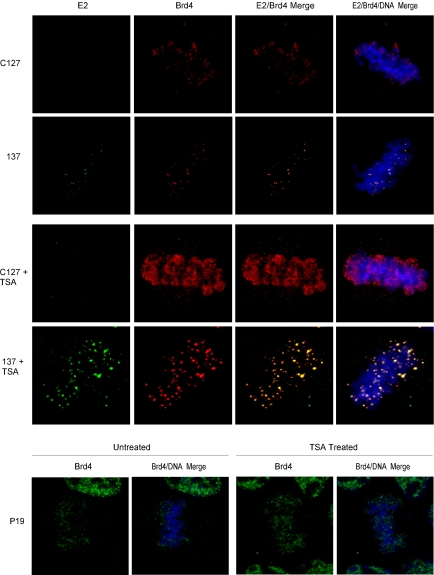
FIG. 2.
TSA increases the amount of chromosomally bound Brd4 in C127, 137, and P19 cells. (Top rows) E2 and Brd4 protein expression was compared by indirect immunofluorescence in C127 and 137 cells, with or without TSA treatment. The E2 protein, as detected by a FITC-labeled antibody, is shown in green; the Brd4 protein, as detected by a Texas Red-labeled antibody, is shown in red; and cellular DNA was detected by DAPI staining and is shown in blue. (Bottom row) The Brd4 protein in P19 cells, with or without TSA treatment, was detected by a FITC-labeled antibody and is shown in green. Cellular DNA was stained with DAPI and is shown in blue.

