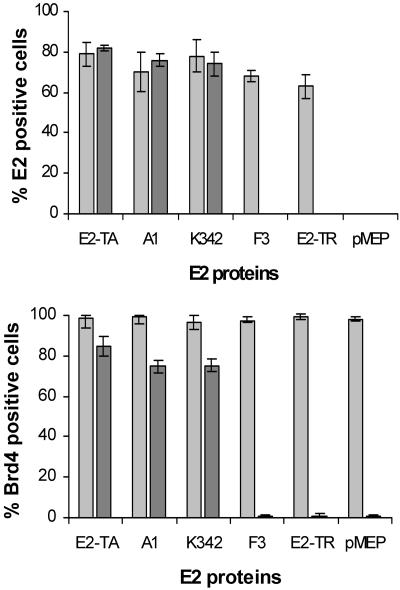
FIG. 6.
Slides of each cell line were scored for E2 (top) and Brd4 (bottom) protein expression before and after salt extraction (light and dark gray bars, respectively). The number of cells that were positive for the E2 or Brd4 protein was expressed as a percentage of the total number of cells counted.

