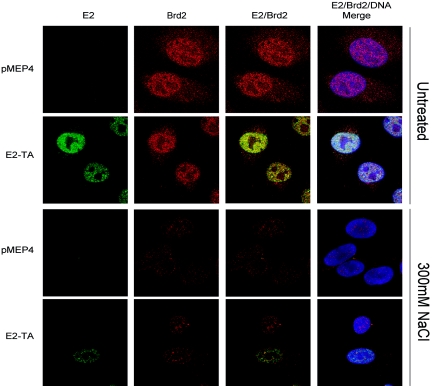
FIG. 8.
E2 expression does not stabilize the association of Brd2 with interphase nuclei. The E2 protein was detected by a FITC-labeled antibody and is shown in green, the Brd2 protein was detected by a Texas Red-labeled antibody and is shown in red, and cellular DNA was detected by DAPI staining and is shown in blue. Brd2 protein levels were compared between cells expressing no E2 (pMEP4) and cells expressing E2-TA. The top panels show untreated cells and the bottom panels show cells following extraction in 300 mM NaCl.

