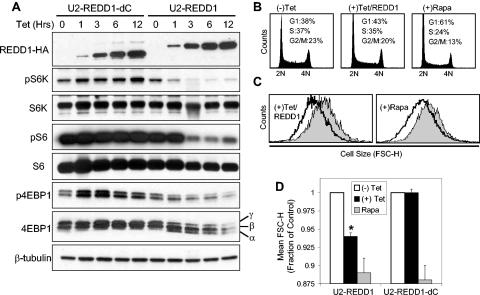
FIG. 5.
REDD1 regulation of mTOR substrate phosphorylation decreases cell size. (A) REDD1, but not REDD1-dC, downregulates phosphorylation of S6K (T389), S6 (S235/236), and 4E-BP1 (T70). Expression of REDD1-dC or REDD1 was induced by addition of tetracycline (1 μg/ml) for the indicated time, and lysates were analyzed by Western blot analysis. The α, β, and γ phosphorylation forms of 4E-BP1 are indicated. (B) Cell cycle profiles of U2-REDD1 cells treated with tetracycline as in panel A or with rapamycin (Rapa, 20 nM) for 48 h and then fixed and stained with PI and analyzed by flow cytometry. (C) REDD1 induction decreases cell size. Representative histogram showing cell size distribution (FSC-H) of G1-gated U2-REDD1 cells treated as in panel B for 48 h (black line) or untreated (grey shading) and then stained with PI and analyzed by flow cytometry. (D) Quantitation of cell size decrease following REDD1 induction. The average of mean FSC-H values from five independent experiments is shown for U2-REDD1 or U2-REDD1-dC cells treated and analyzed as in panel C. *, P = 0.001 versus (−) Tet. Error bars show 1 standard deviation.

