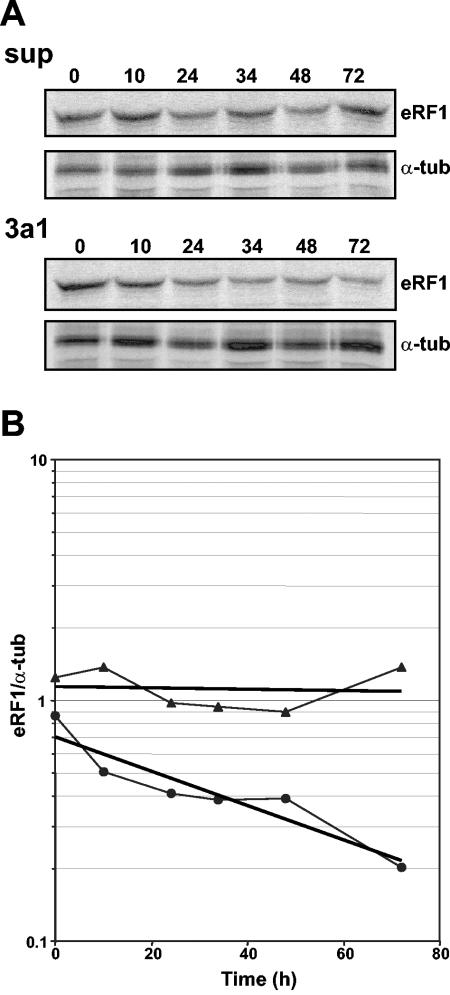
FIG. 6.
Stability of eRF1 protein in eRF3a-depleted cells. (A) 559C cells were labeled 3 days after electroporation with pSuper (sup) or si-3a1-expressing (3a1) plasmid by a 2-hour pulse with a mixture of [35S]methionine and [35S]cysteine, followed by a chase for various times as indicated above the lanes. Labeled proteins were immunoprecipitated with anti-eRF1 and anti-α-tubulin (α-tub) antibodies and separated by sodium dodecyl sulfate-polyacrylamide gel electrophoresis. Dried gels were revealed by autoradiography. (B) eRF1 and α-tubulin bands were quantified using the BAS1000 Fuji image plate program version 2.0, and the eRF1/α-tubulin ratio at each time point was plotted on a semilogarithmic graph: eRF1/α-tubulin ratios in pSuper-electroporated cells (filled triangles); eRF1/α-tubulin ratios in si-3a1-expressing cells (filled circles). The regression line is presented for each curve.

