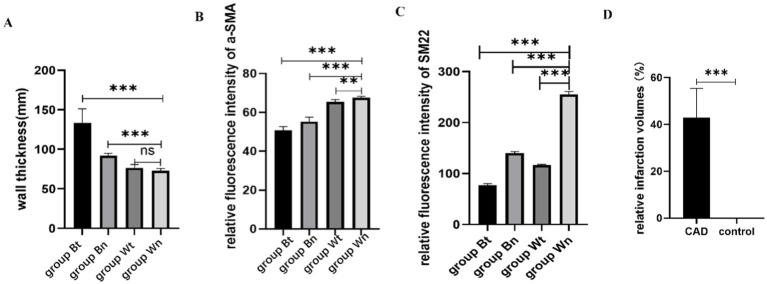
Figure 6.
The statistical results of average wall thickness, expression levels of contractile proteins and relative infarction volumes. The average thickness of the walls in group Bt and group Bn were significantly thicker than that in group Wn. There was no significant difference between group Wt and group Wn in average wall thickness (A). The expression of a-SMA protein in group Bt, group Bn and group Wt were significantly decreased compared with group Wn. The decrease in group Bn and group Wt were not as obvious as that in group Bt (B). The expression of SM22a protein in group Bt, group Bn and group Wt were significantly decreased compared with group Wn. The decrease in group Bn and group Wt were not as obvious as that in group Bt (C). The relative infarction volumes of CAD group rats were significantly larger than control group (D).

