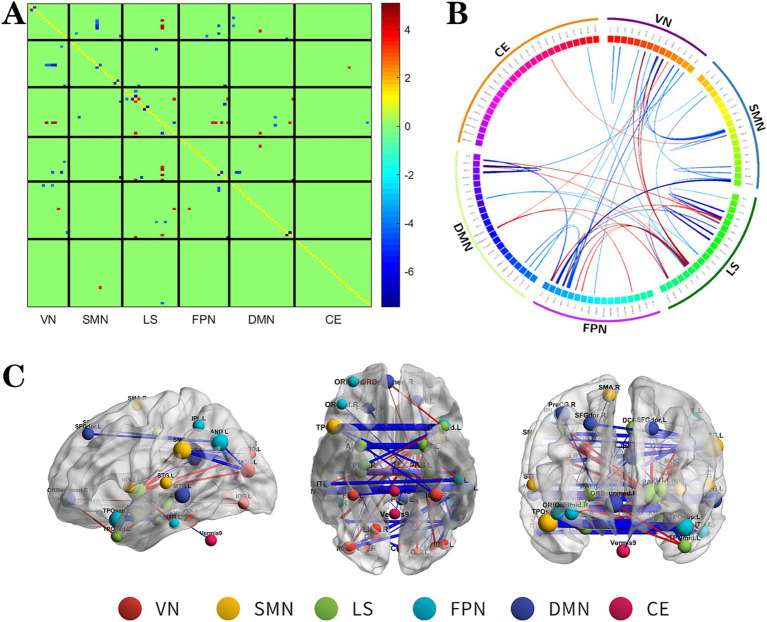
Figure 3.
The changes metabolic correlation network between the SF group and HC group. (A–C) represent the connectivity matrix maps, Circos and connectivity graph of the metabolic connectivity comparison between the NSF group and SF group. DMN, default mode network; LS, limbic system; FPN, frontoparietal network; VN, visual network; SMN, sensorimotor network.

