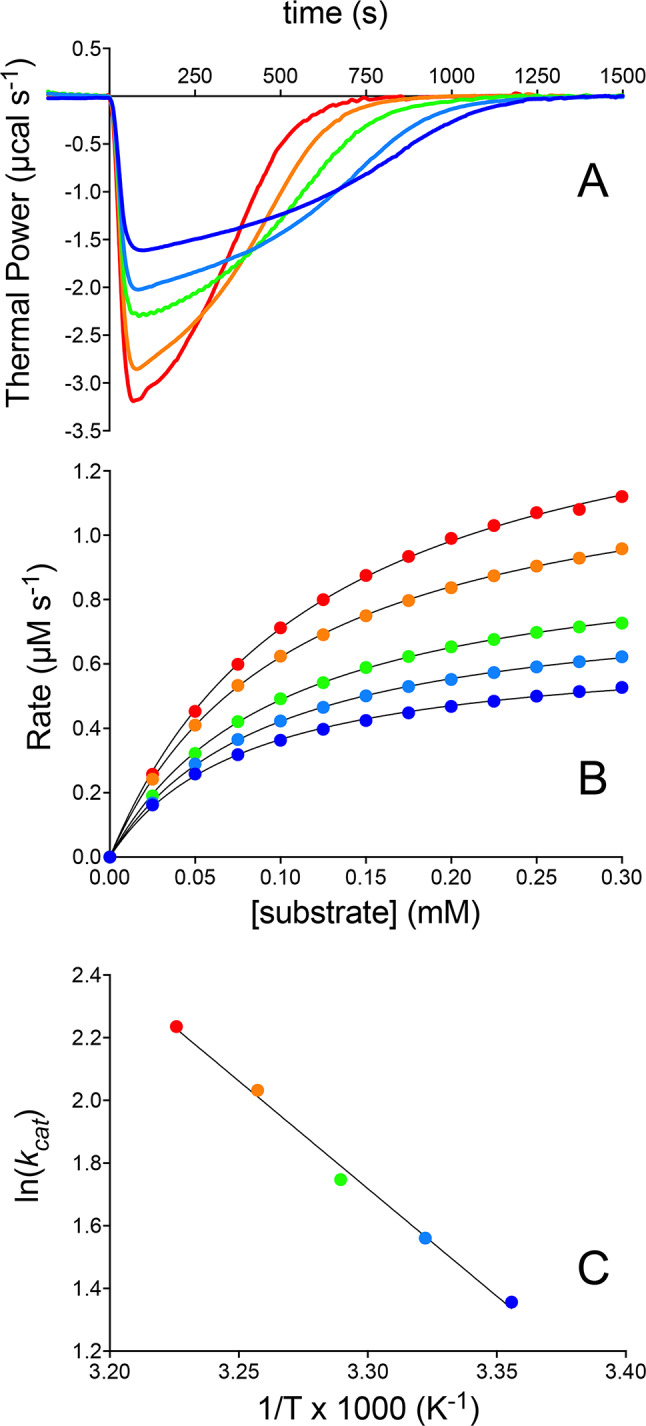
Fig. 5.

3CLpro kinetics at pH 7.5 characterized by ITC. (A) Thermal power recorded over time following injection of 150 nM 3CLpro into a sample cell containing 0.35 mM substrate at 298 K (dark blue line), 301 K (cyan line), 304 K (green line), 307 K (orange line), and 310 K (red line). (B) Corresponding reaction rates calculated using Eq. 4 and fits to the Michaelis–Menten equation shown as colored lines. The reaction rates represent a subset of the experimentally measured data points (a few hundred in total), selected every 0.025 mM for clarity. (C) Arrhenius plot depicting the logarithm of the kcat values against the inverse temperature, 1/T, used to determine the activation energy. In panels (B,C), the color-code corresponds to that in (A).
