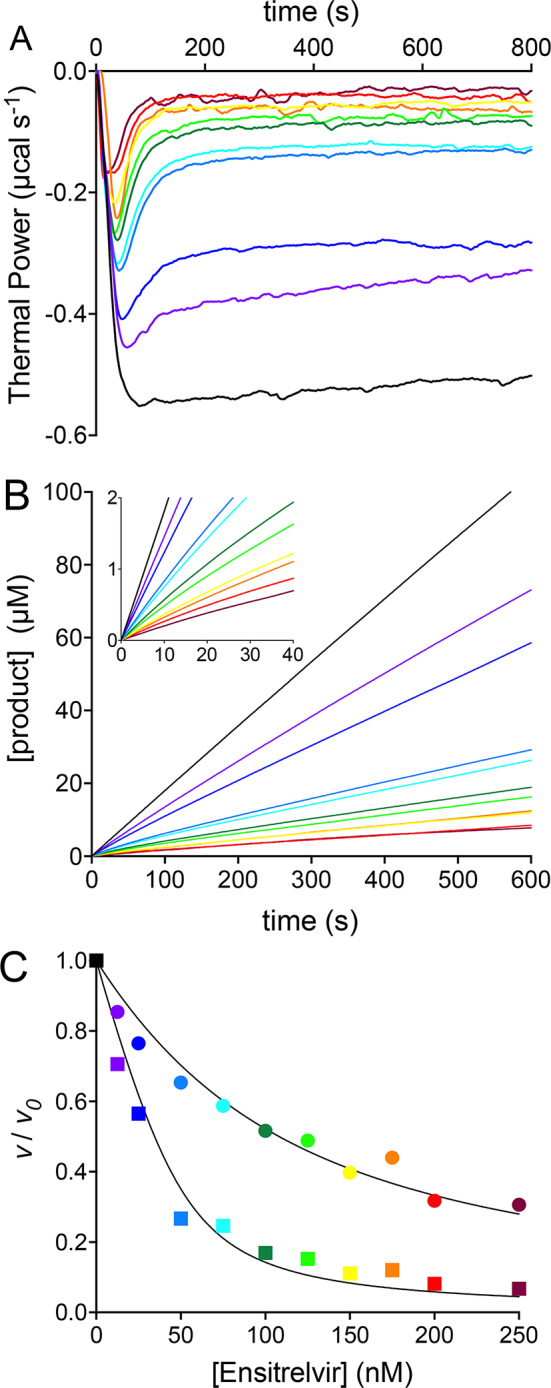
Fig. 7.

3CLpro inhibition by Ensitrelvir at pH 7.5 and 298 K characterized by ITC. (A) Thermal power recorded over time following the injection of 50 nM 3CLpro into the sample cell containing 0.60 mM substrate, in the absence of inhibitor (black) and supplemented with Ensitrelvir at concentrations of 12.5 nM (grape), 25 nM (blue), 50 nM (cyan), 75 nM (turquoise), 100 nM (dark green), 125 nM (light green), 150 nM (yellow), 175 nM (orange), 200 nM (red), 250 nM (maroon). (B) Progress curves derived from the raw data shown in (A); the inset shows the 0 – 40 s portion of each time course depicting the transition between the initial and the steady state phases. (C) vi / v0 (circles) and vs / v0 (squares) vs. Ensitrelvir concentration plots and corresponding fits to Eq. 8. In panels (B,C), the color-code corresponds to that in (A).
