
Figure 3.
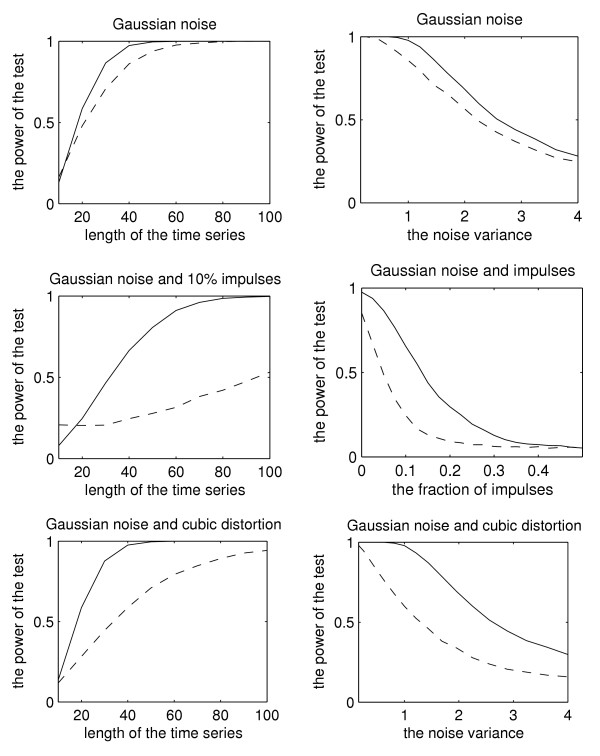
Power of the test. The power of the tests (y-axis) for the three different test cases as the function of the time series length and varying noise parameters (x-axis). The solid (resp. dashed) line corresponds to the proposed robust method (resp. Fisher's test). Three different types of non-idealities are considered, namely, pure standard Gaussian noise (the first row), standard Gaussian and impulsive noise (the second row), and standard Gaussian noise and x3 distortion (the third row). The left (resp. right) column shows the results for different time series lengths (resp. different values of the noise parameters).