Figure 3.

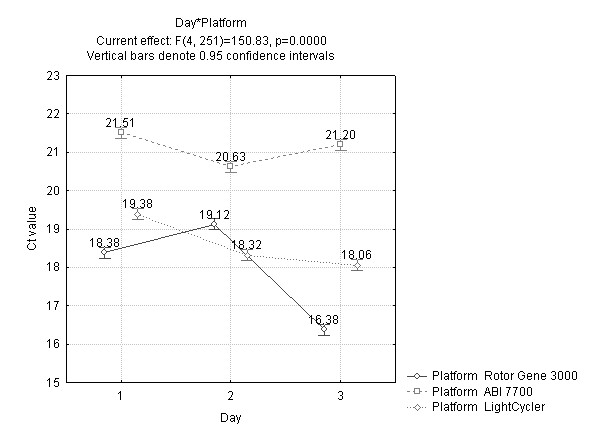
Average threshold cycle number (Ct) plotted against day for each platform illustrating the interaction of day and platform. The data have been pooled from each PCR reaction mix and plasmid dilution.

Average threshold cycle number (Ct) plotted against day for each platform illustrating the interaction of day and platform. The data have been pooled from each PCR reaction mix and plasmid dilution.