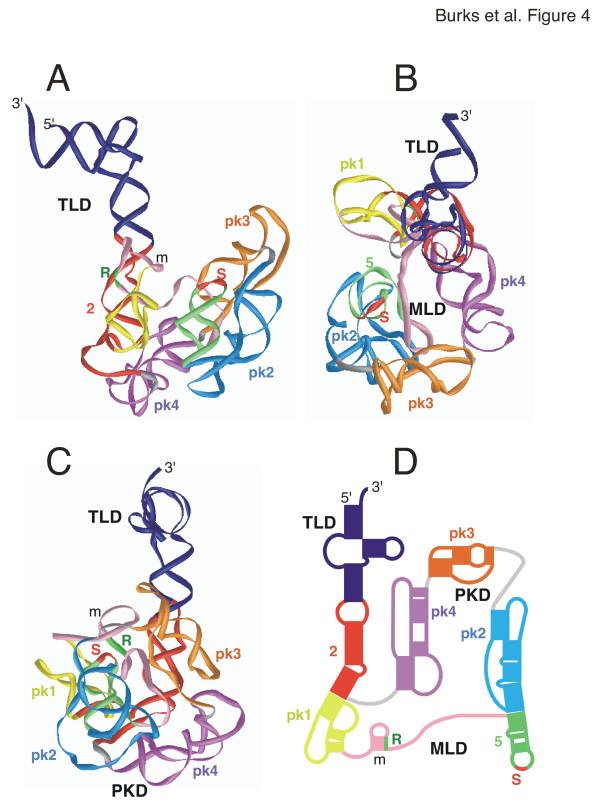
Figure 4.
3-D model of Bacillus anthracis tmRNA. The 3-D model of Bacillus anthracis tmRNA is viewed as a ribbon diagram from the side in panel A, the top in panel B, and in panel C turned by approximately 90° around the y-axis in relation to A. Panel D shows a representation of the corresponding 2-D structure using the identical coloring scheme. Labeled are the 5' and 3' ends, the resume (R) and stop codons (S), and the three domains (TLD, MLD, PKD). The figure was produced with iMol [53] and the PDB coordinates of additional file 9: Banthracis-closed.pdb.

