Figure 6.
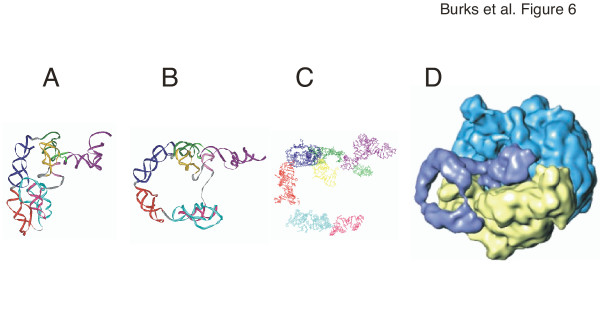
Conformational changes in Escherichia coli tmRNA. Panel A: closed form of the E. coli model as shown in Figure 3. Panel B: open conformation adjusted to more closely resemble the ribosome-bound form as determined by cryo-EM [10] using additional file 8: Ecoli-open.pdb. Panel C: coordinates extracted from the cryo-EM model [10]. The TLD is shown in dark purple, helix 2 in green, pk1 in yellow, helix 5 in pink, pk2 in turquoise, pk3 in red, and pk4 in dark blue. Panel D: Electron density map of the 50S subunit in light blue, the 30S subunit in yellow, and the bound tmRNA (in the absence of ribosomal protein S1) in dark blue (from [10]).

