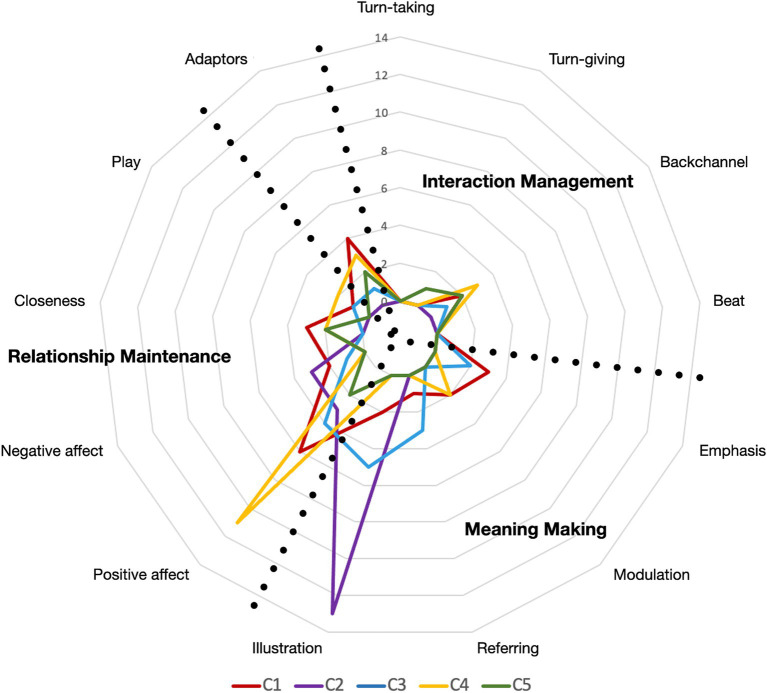
Figure 4.
Visual-touch functions. This graph presents the distribution of the functions across couples (C1 to C5). Each coloured line represents a couple, and each concentric line represents the number of reported functions from 0 (the most central line) to 14 (the outer line). The three dimensions of functions are superimposed onto the graph.

