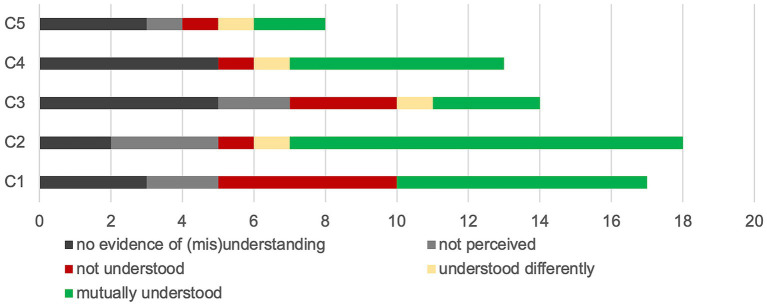
Figure 5.
Mutual understanding of the visual-touches. This graph illustrates the mutual understanding levels. Each couple (C1 to C5) is represented on a line and from left to right is presented the number of visual-touch behaviours which are: discussed but no evidence of understanding or misunderstanding is accessible, not perceived by the receiver, not understood by the receiver, understood differently from the sender intention, or mutually understood.

