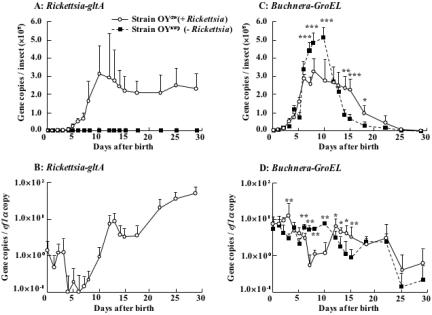
FIG. 4.
Infection dynamics of Rickettsia and Buchnera in the developmental course of the host aphid. (A) Rickettsia titers in terms of gltA gene copies per insect. (B) Rickettsia densities in terms of gltA gene copies per ef1α gene copy. (C) Buchnera titers in terms of groEL gene copies per insect. (D) Buchnera densities in terms of groEL gene copies per ef1α gene copy. Open circles, the Rickettsia-infected aphid strain OYdw; closed squares, the Rickettsia-eliminated aphid strain OYamp. Means and standard deviations are shown (n = 12, respectively). Asterisks indicate statistically significant differences (Mann-Whitney U test; *, P < 0.05; **, P < 0.01; ***, P < 0.001). The measurements were conducted at 18 to 20 generations after the injection treatments.

