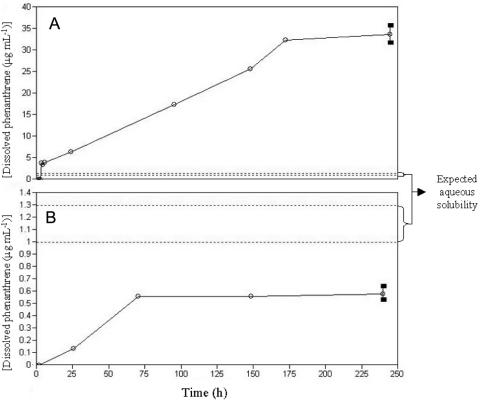
FIG. 1.
Equilibrium dialysis analysis of sorption (A) and desorption (B) of phenanthrene by a 2% (wt/vol) humic acid solution. Open circles represent data points. The two broken lines indicate the upper and lower values reported in the literature for the aqueous solubility of phenanthrene. Error bars (filled rectangles) at endpoints represent 95% confidence intervals.

