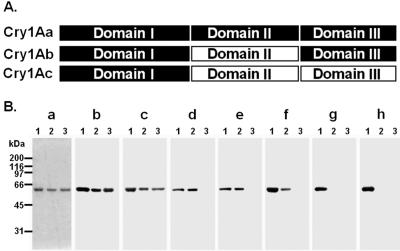
FIG. 4.
Immunoblot analysis of the reactivity of each MAb with the three toxins. (A) Schematic representation of the domain similarities of Cry1Aa, Cry1Ab, and Cry1Ac. (B) Approximately 1 μg of Cry1Aa (lane 1), Cry1Ab (lane 2), and Cry1Ac (lane 3) was subjected to SDS-PAGE, transferred to a nitrocellulose membrane, and probed with MAbs 3C7 (blot b), 1G10 (blot c), 1B10 (blot d), 2C2 (blot e), 1E10 (blot f), 2F9 (blot g), and 2A11 (blot h). The proteins on the gels were visualized by Coomassie brilliant blue staining (gel a).

