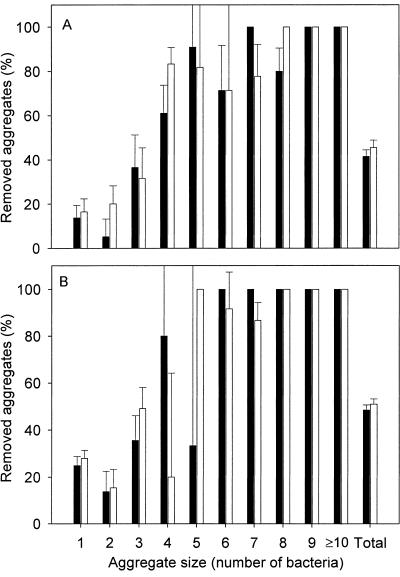
FIG. 5.
Percent removal of aggregates from the glass surface after 2 min (solid bars) and after 10 min (open bars) at a wall shear rate of 16,000 s−1 with microbubbles (A) and at 11,000 s−1 without microbubbles (B) as a function of aggregate size. Error bars denote standard deviations over nine fields of view, equally divided over three separate experiments.

