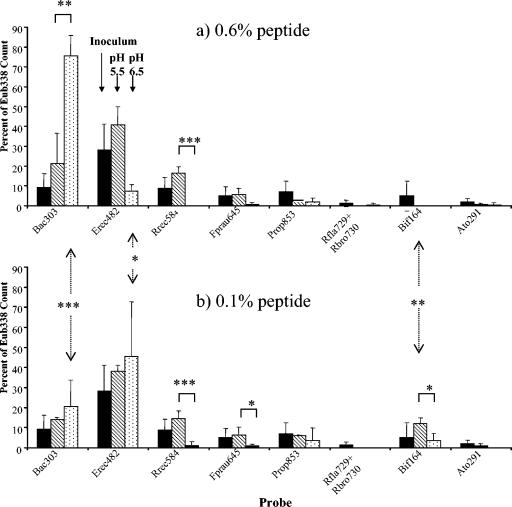
FIG. 3.
Effect of pH upon the abundance of major bacterial groups, expressed as a proportion of the total (Eub338) counts, in continuous fermentor cultures with high (0.6%) (a) and low (0.1%) (b) peptide input. Mean proportions are calculated from the FISH counts given in Table 3 and refer to all of the experiments involving the two donors that are summarized in Table 2 and illustrated in Fig. 1 and 2. Means are given for the initial 0.5-h time point (▪), after incubation at pH 5.5 (▧), and after incubation at pH 6.5 (□). Statistical significance for the effects of different pH and peptide regimes is indicated as follows: ✽, P = <0.05; ✽✽, P = <0.01; ✽✽✽, P = <0.001.

