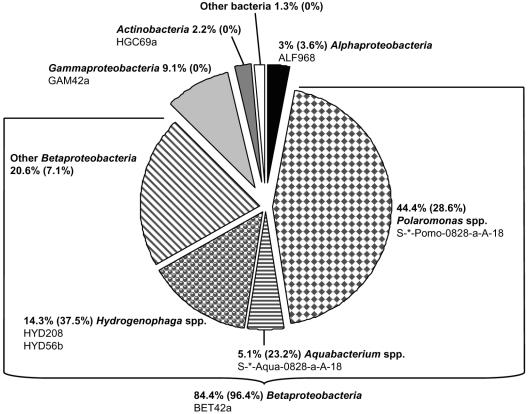
FIG. 3.
Pie chart showing the microbial community composition of a natural mineral water approximately 3 weeks after bottling as determined by FISH and microscopic counting. The probes used for assignment to the different groups are listed. If more than one probe is listed for a single group almost identical results (±1%) were obtained with each of the probes. The percentage refers to the proportion of group- or genus-specific probe-labeled cells of all DAPI-positive cells divided by the proportion of EUBmix-labeled cells of all DAPI-positive cells. The percentage in parentheses indicates the abundance of 16S rRNA gene sequences of the respective bacterial group in the pooled 16S rRNA gene libraries B, C, and D.

