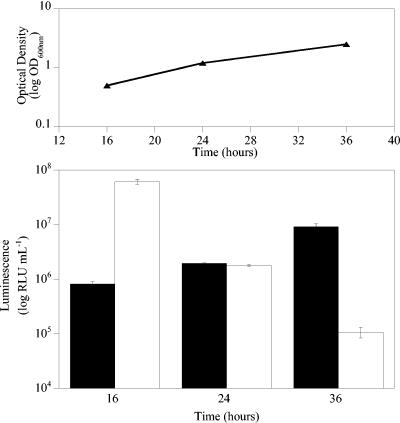
FIG. 4.
Gluc bioluminescence correlates with bacterial cell number throughout the exponential and stationary phases of growth. The upper panel shows optical density plotted against time, and the lower panel shows a plot of luminescence versus time. Solid bars, luminescence from M. smegmatis expressing Gluc; open bars, luminescence from M. smegmatis expressing luxAB. The error bars indicate standard deviations.

