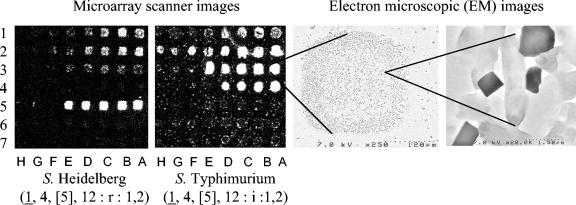
FIG. 1.
Examples of antibody microarray images, indicating (a) the cells captured by the antibody microarray; (b) both phase flagellar (H1 and H2) antigens and O antigens detected simultaneously; and (c) different antibodies exhibited different optimal concentrations which also varied with different strains used. Rows 1 to 7 of the microarrays contained antibodies O:4, O:5, H:2, H:i, H:r, O:9, and H:m. Columns A to H of the microarrays represent twofold (0, 2, 4, 8, 16, 32, 64, and 128) serial dilutions of the original antibody concentrates whose protein concentrations were between 16 and 54 mg/ml. The two electron microscopic images were taken at magnifications of ×250 and ×20,000, respectively.

