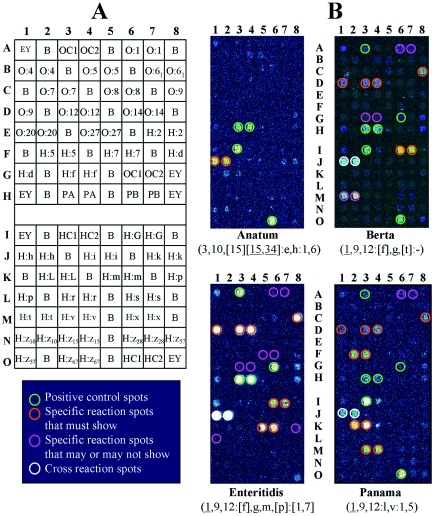
FIG. 2.
Representative microarray images for identification of Salmonella serovars using the model antibody microarray assay. Panel A: map of the antibodies on the model microarray. EY, Eosin Y solution (used for locating arrays). B, printing buffer. PA and PB, poly A and poly B, respectively. OC1 and OC2, pools of O factor antisera; HC1 and HC2, pools of H factor/phase antisera that were also used as individuals on the microarray. Panel B: microarray images for identification of Salmonella serovars Berta, Enteritidis, and Panama and also for exclusion of serovar Anatum from the 20 target serovars. The figure represents half of the actual array (the duplicate part is not shown).

