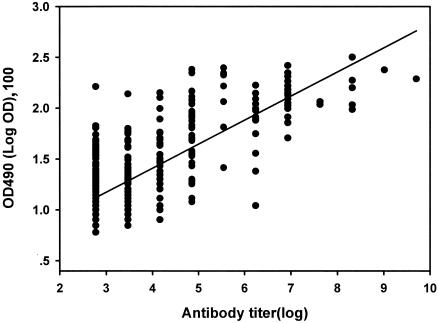
FIG. 1.
Relationship between antibody titer by GPAT and ELISA value (OD490) for samples from 459 individuals in five localities in northeast Thailand. The data shown are the observed values, and the solid line is the linear regression line with a slope of 0.241 and a y-axis intercept of 0.45 (t = 25.7; P < 0.001; R = 0.77).

