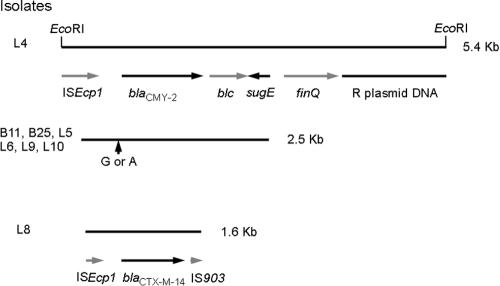
FIG. 4.
Map of blaCMY-2 and blaCTX-M-14 regions from ceftriaxone-resistant Salmonella isolates. Black lines indicate the DNA fragments sequenced. The restriction enzyme sites of EcoRI used for cloning are shown at the top. Arrows below the black lines indicate various genes. The vertical arrow indicates the only nucleotide difference, which occurred at nucleotide 49 upstream of the start codon of blaCMY-2, resulting in either an A or a G.

