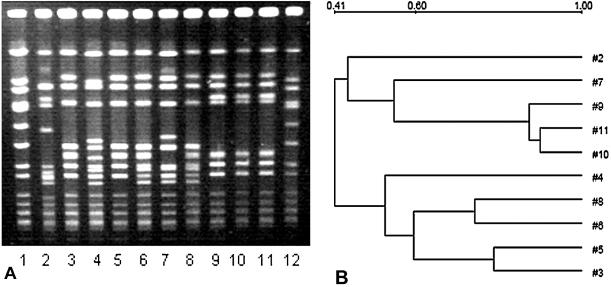
FIG. 1.
(A) PFGE patterns of SmaI digests of MRSA isolates from the two hospitals. Lanes 1 and 12, NCTC 8325; lanes 2 to 5, SJ isolates; lanes 6 to 11, M isolates. (B) Dendrogram based on the similarities derived from the UPGMA and Dice coefficients, using Quantity One software. The scale at the top represents similarity.

