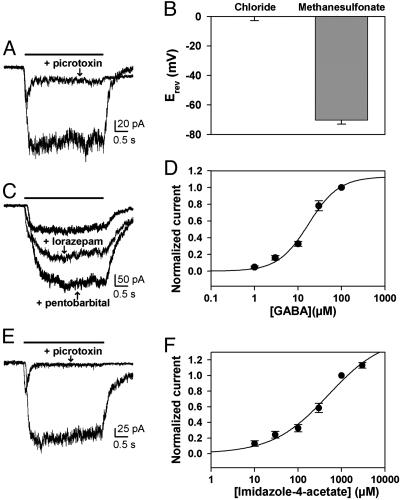
Fig. 4.
Functional evidence for GABAA receptor expression in PNEC cells. The horizontal bar indicates the duration of drug exposure. (A) Responses to 100 μM GABA ± 100 μM picrotoxin. (B) Reversal potential of GABA currents, obtained from digital subtractions of current responses to voltage ramps in the presence and absence of 30 μM GABA and measured by using the indicated pipette solutions (n = 3 cells for each pipette solution). (C) Responses to 10 μM GABA ± 1 μM lorazepam or 50 μM pentobarbital. (D) Concentration-response curve for GABA. The solid line represents a fit of the plotted data to the Hill equation, which estimated a half-maximum concentration of 17.5 μM for GABA (n = 8 cells per point). (E) Responses to 1 mM imidazole-4-acetate ± 100 μM picrotoxin. (F) Concentration-response curve for imidazole-4-acetate. The solid line represents a fit of the plotted data to the Hill equation, which estimated an EC50 value of 500 μM(n = 5–10 cells per point).

