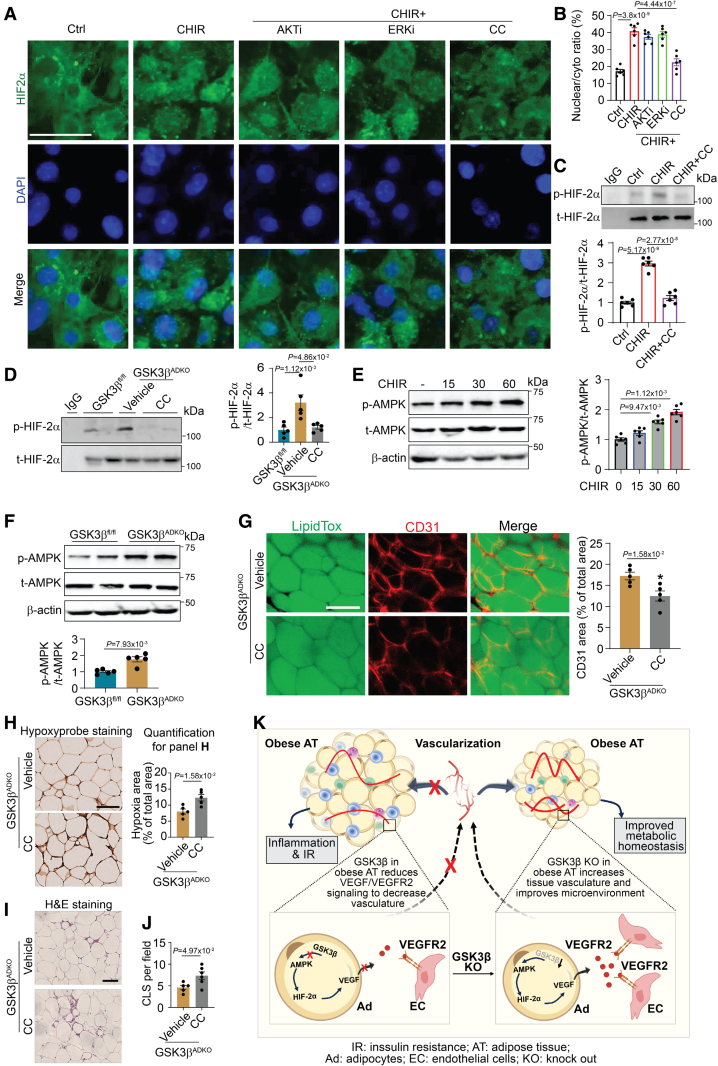
Figure 8.
AMPK (AMP-activated protein kinase) regulates the HIF-2α/VEGF (hypoxia-inducible factor 2-alpha/vascular endothelial growth factor) axis to mediate the effects of adipocyte-specific GSK3β (glycogen synthase kinase-3 beta) deficiency on tissue vascularity and the microenvironment of obese adipose tissue by stimulating HIF-2α nuclear accumulation. A and B, Nuclear accumulation of HIF-2α in mature 3T3-L1 adipocytes upon GSK3 inhibition with CHIR99021 (CHIR, 10 μM) and with or without the treatment of inhibitors targeting other kinases, AKT inhibitor-Triciribine (AKTi, 10 µmol/L), ERK inhibitor SCH772984 (ERKi, 300 nmol/L), and AMPK inhibitor (CC, 10 µmol/L) under hypoxic conditions (1%; A) for 4 hours. Analysis of nuclear/cytoplasmic ratios (B; n=6). C and D, HIF-2α phosphorylation analysis of pulled down total HIF-2α and quantification vs total HIF-2α in mature 3T3-L1 adipocytes with the indicated treatment for 4 hours (C, n=6) and in epididymal white adipose tissue (eWAT) from male GSK3βfl/fl and GSK3βADKO mice fed an high-fat diet treated with or without the AMPK inhibitor (GSK3βADKO+CC [10 mg/kg]) for 2 weeks (D, n=5). E and F, AMPK phosphorylation analysis in mature 3T3-L1 adipocytes with CHIR treatment (10 μmol/L) for indicated time points (E, n=6) and in eWAT from male obese GSK3βADKO and GSK3βADKO+CC mice (F, n=5). G, Whole-mount CD31 staining and CD31-positive area quantification from male obese GSK3βADKO and GSK3βADKO+CC mice (n=5). H through J, Representative images of hypoxyprobe staining of eWAT and quantification of staining (H, n=5), hematoxylin and eosin staining of eWAT (I) and CLS quantification (J, n=5) from male obese GSK3βADKO and GSK3βADKO+CC mice. K, A simplified scheme to represent how GSK3β regulates adipose tissue vasculature of obese mice. The absence of GSK3β in adipocytes initiates the AMPK/HIF-2α/VEGF/VEGFR2 axis, which orchestrates an expansion of the vasculature within obese adipose tissue. Consequently, this phenomenon leads to a significantly improved local microenvironment in obese adipose tissue, resulting in reduced inflammation and a notable improvement of obesity-associated metabolic complications. Scale bar=100 µm. B and D, One-way ANOVA and Tukey post hoc test; E, repeated ANOVA and Bonferroni post hoc test; F through I, nonparametric test.

