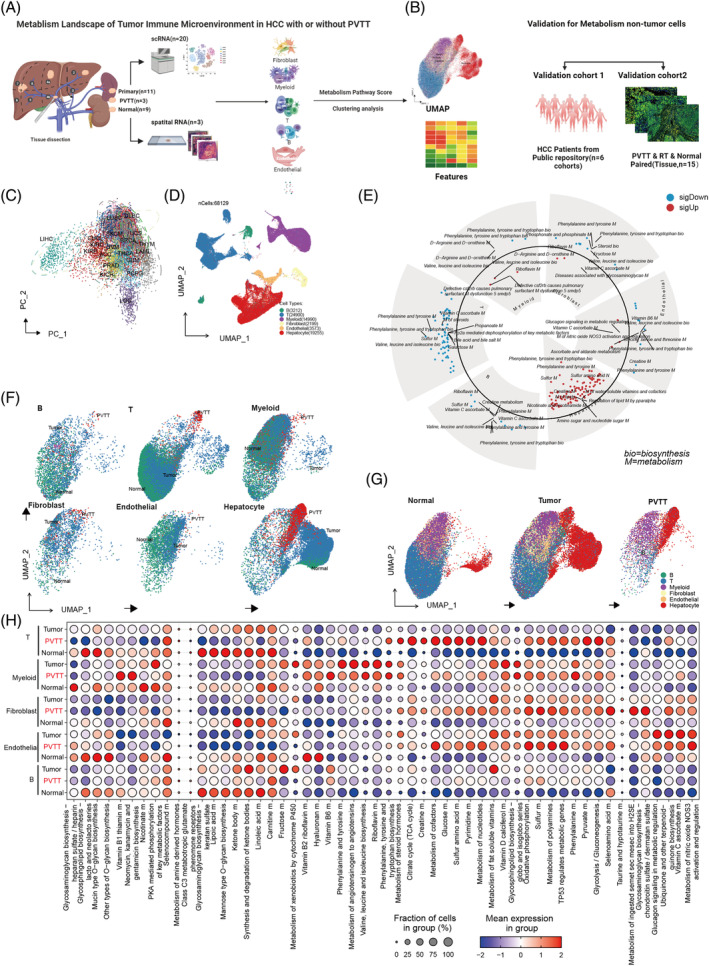
FIGURE 1.

Metabolic Heterogeneity in the Tumour Microenvironment of HCC with PVTT. (A) and (B) Design flowcharts for studying metabolic heterogeneity in PVTT. (C) Enhanced metabolic characteristics in LIHC compared with other tumours. (D) Single‐cell cohort consisting of six primary cell types. (E) Variations in metabolic pathway enrichment across different cell types. (F) UMAP plots illustrating metabolic scores in B, T, Myeloid, Fibroblast, Endothelial, and Hepatocyte cells. (G) UMAP plots of metabolic scores in the normal, tumour, and PVTT samples. (H) Heterogeneity of metabolic scores in different cells from various sources, based on an analysis of tissue‐specific differences.
