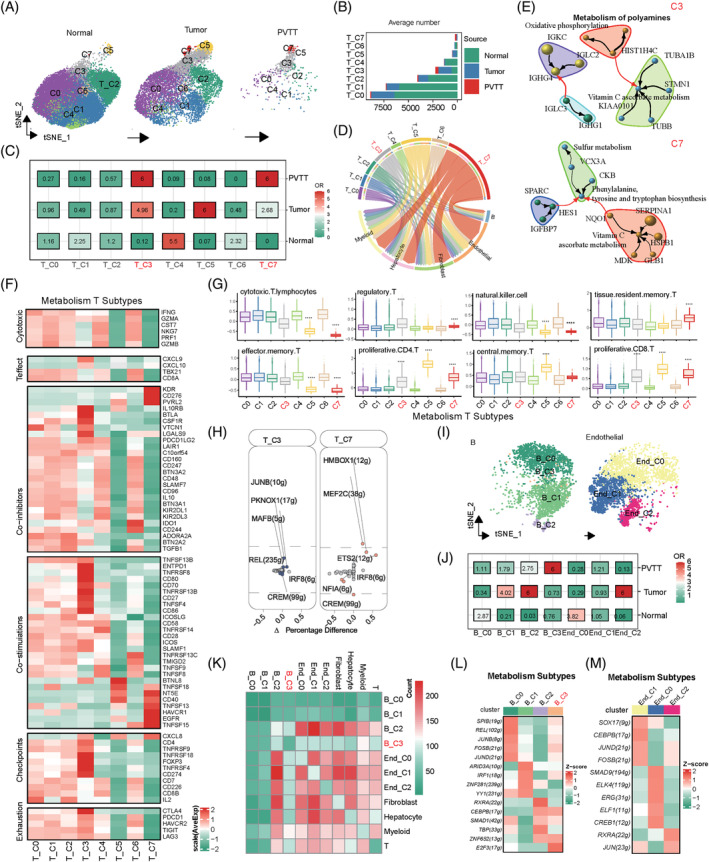
FIGURE 4.

Analysis of metabolic heterogeneity in T, B, and endothelial cells. (A) Classification of metabolic scores of T‐cells from various sample sources. (B) Differences in cell numbers of the eight metabolically classified T cell types across different samples. (C) Tissue propensity analysis of the eight metabolic classifications of T cells. (D) Cell communication analysis between eight metabolically classified T‐cell types and other cells. (E) Correlation analysis of the top three metabolic pathways and top 10 genes in T‐C3 and T‐C7 cells. (F) Differential expression analysis of major immune genes in eight metabolically classified T‐cell types. (G) Differential expression of major cell‐type scores in eight metabolic classifications of T cells (symbols indicate significant differences between groups). (H) Key activated transcription factors in T‐C3 and T‐C7 cells. (I) Classification of metabolic scores in B and endothelial cells from various sample sources. (J) Tissue source propensity analysis of metabolic classifications in B and endothelial cells. (K) Cell communication analysis of B and endothelial cells in different metabolic states with other cells. (L) Differences in transcription factor activation among the four metabolic states of the B cells. (M) Transcription factor differences in the three metabolic states of endothelial cells.
