Figure 3.
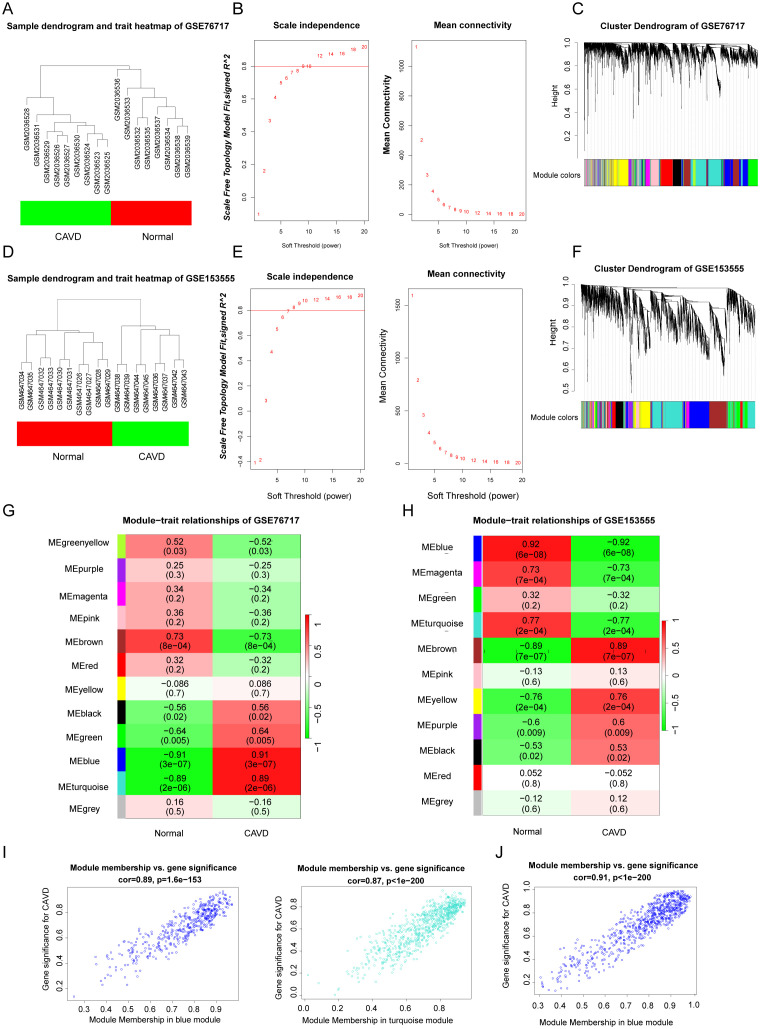
(A, D) Sample clustering of the GSE76717 and GSE153555 datasets. Samples were clustered into two significantly different clusters respectively. (B, E) Selection of optimal thresholds for GSE76717 and GSE153555, with values of 12 and 9, respectively. (C, F) Gene co-expression modules represented by various colors in the gene tree diagram. (G, H) Significant gene modules in GSE153555 and GSE76717 were identified in the heatmap. Heatmap showing the correlation between module eigengenes and sample types. The correlation (upper) and p-value (bottom) between module eigengenes and CAVD status are shown. (I, J). The correlation plot between the most significant module membership and gene significance indicated that the selected modules were closely related to CAVD.

