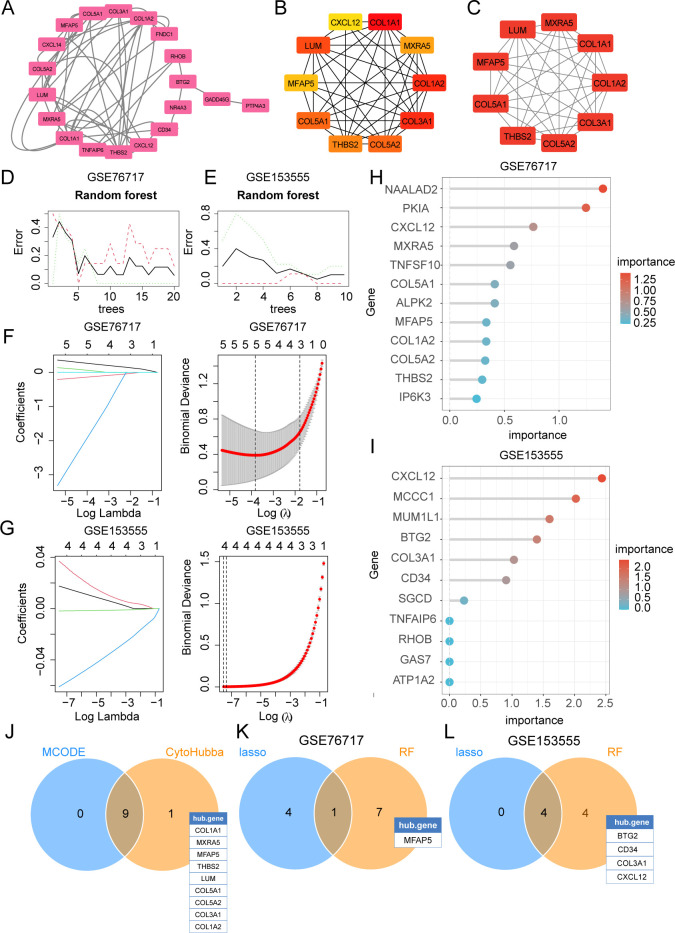
Figure 6.
Selection of diagnostic biomarkers for CAVD by PPI network and machine learning (ML). (A) The PPI network of IADEGs. (B) The top 10 hub genes identified using the degree method with the CytoHubba plugin (Cytoscape). (C) The 9 genes with the highest MCODE scores in the PPI network were defined as hub genes. (D, E) The DEGs corresponding to the lowest binomial deviance were identified as the most suitable candidates. (F, G) Random forest was used to analyze the relationships between the number of trees and the error rate. (H, I) The plot shows iDEGs ranked based on the importance score calculated from the random forest. (J) The 9 intersecting genes recognized by the two PPI-based methods. (K, L) 5 hub genes were respectively selected from two datasets by two ML algorithms as potential hub iDEGs for further evaluation.

