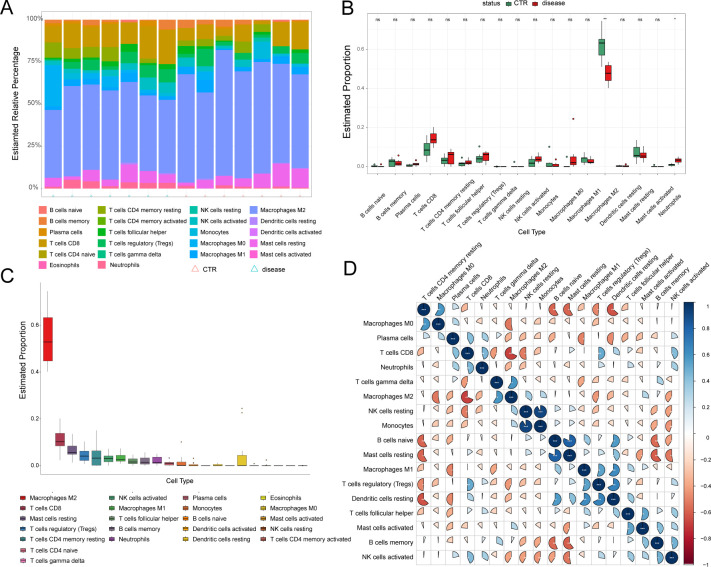
Figure 8.
Immune cell infiltration analysis. (A) Stacked histogram displaying the proportion of immune cell types between normal and CAVD groups. (B) A box plot displaying the proportions of 22 kinds of immune cells between normal and CAVD groups. (C) The percentage of immune cells infiltrating in CAVD was calculated. (D) A heatmap showing the correlations between the infiltrating immune cell types. The comparison between the two groups was performed using the Mann-Whitney U-test, ns: no significance, p < 0.05, *p < 0.01.

