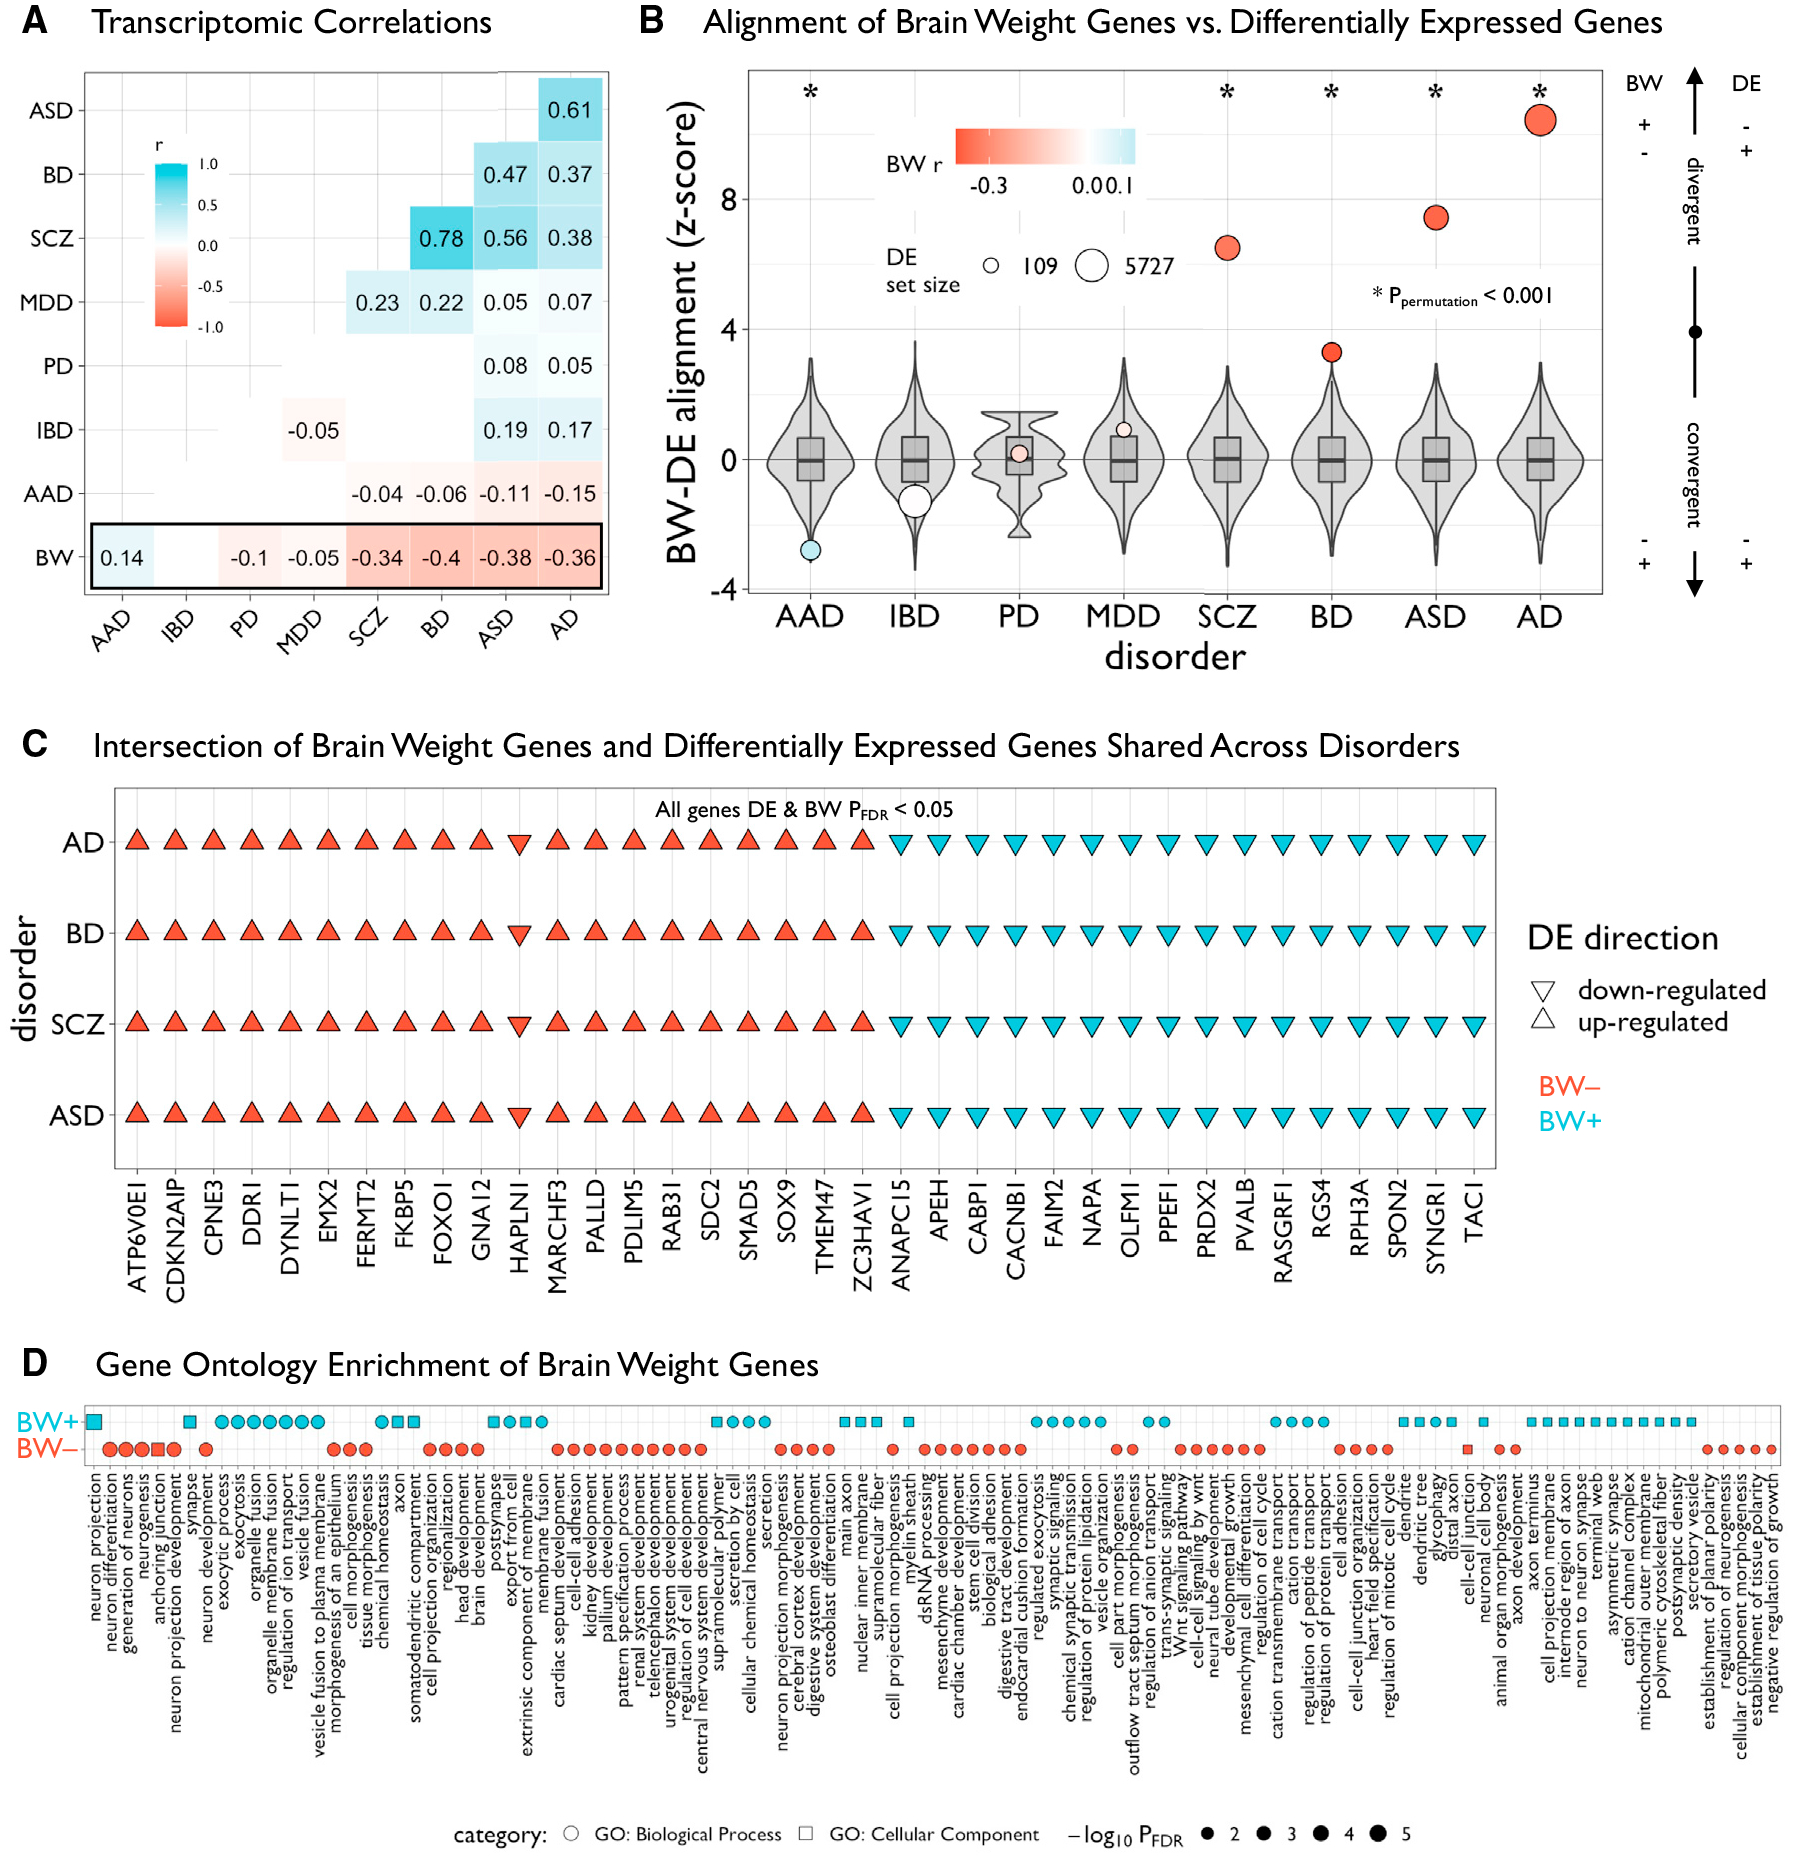
Figure 3. BW gene sets are differentially enriched across disease and functional domains.

(A) Matrix of transcriptomic correlations of differential expression (DE) statistics in multiple human diseases and BW statistics in the PsychENCODE dataset. Pairwise Pearson’s r coefficients were computed across overlapping genes between datasets (n = 4,226)—only significant (pBonferroni < 0.05) values are plotted. Autism spectrum disorder (ASD), bipolar disorder (BD), schizophrenia (SCZ), major depressive disorder (MDD), Parkinson’s disease (PD), alcohol abuse disorder (AAD), Alzheimer’s disease (AD). Inflammatory bowel disease (IBD) was included as a non-neural control.
(B) Plot showing the alignment of BW and DE genes within each disorder. Intersecting lists of significant BW and DE genes (both pFDR < 0.05) were categorized as “convergent” or “divergent” based on the concordance of the directions of effects, then Z scored according to a null distribution based on 10,000 resamples of BW gene sets of similar size (gray box-violins). Circles are sized according to the number of DE genes and colored according to values in (A). Asterisks denote significant (ppermutation < 0.001) Z scores.
(C) Grid plot showing 36 significant BW and DE genes (DE and BW pFDR < 0.05) in patients with AD, BD, SCZ, and ASD. Triangles represent directions of effects (up- or downregulated in patients compared with controls) and colors denote the respective BW gene set.
(D) Grid plot showing significant (pFDR < 0.05, reduced for visualization, see Table S5) Gene ontology enrichment of BW-associated genes for biological processes (circles) and cellular components (squares) using ToppGene.56 Shapes are sized and ordered (high-to-low) according to adjusted negative log-scaled p values.
All box-violin plots show median and IQR with whiskers denoting 1.5 × IQR.
